

Understanding your reports
Read your sales, orders, best sellers and daily trends, and see what card payments cost you and when payouts arrive.
The Reports page shows how your restaurant is doing: what you sold, which items move, how each day went, and what card payments cost you. Admins and managers can open it.
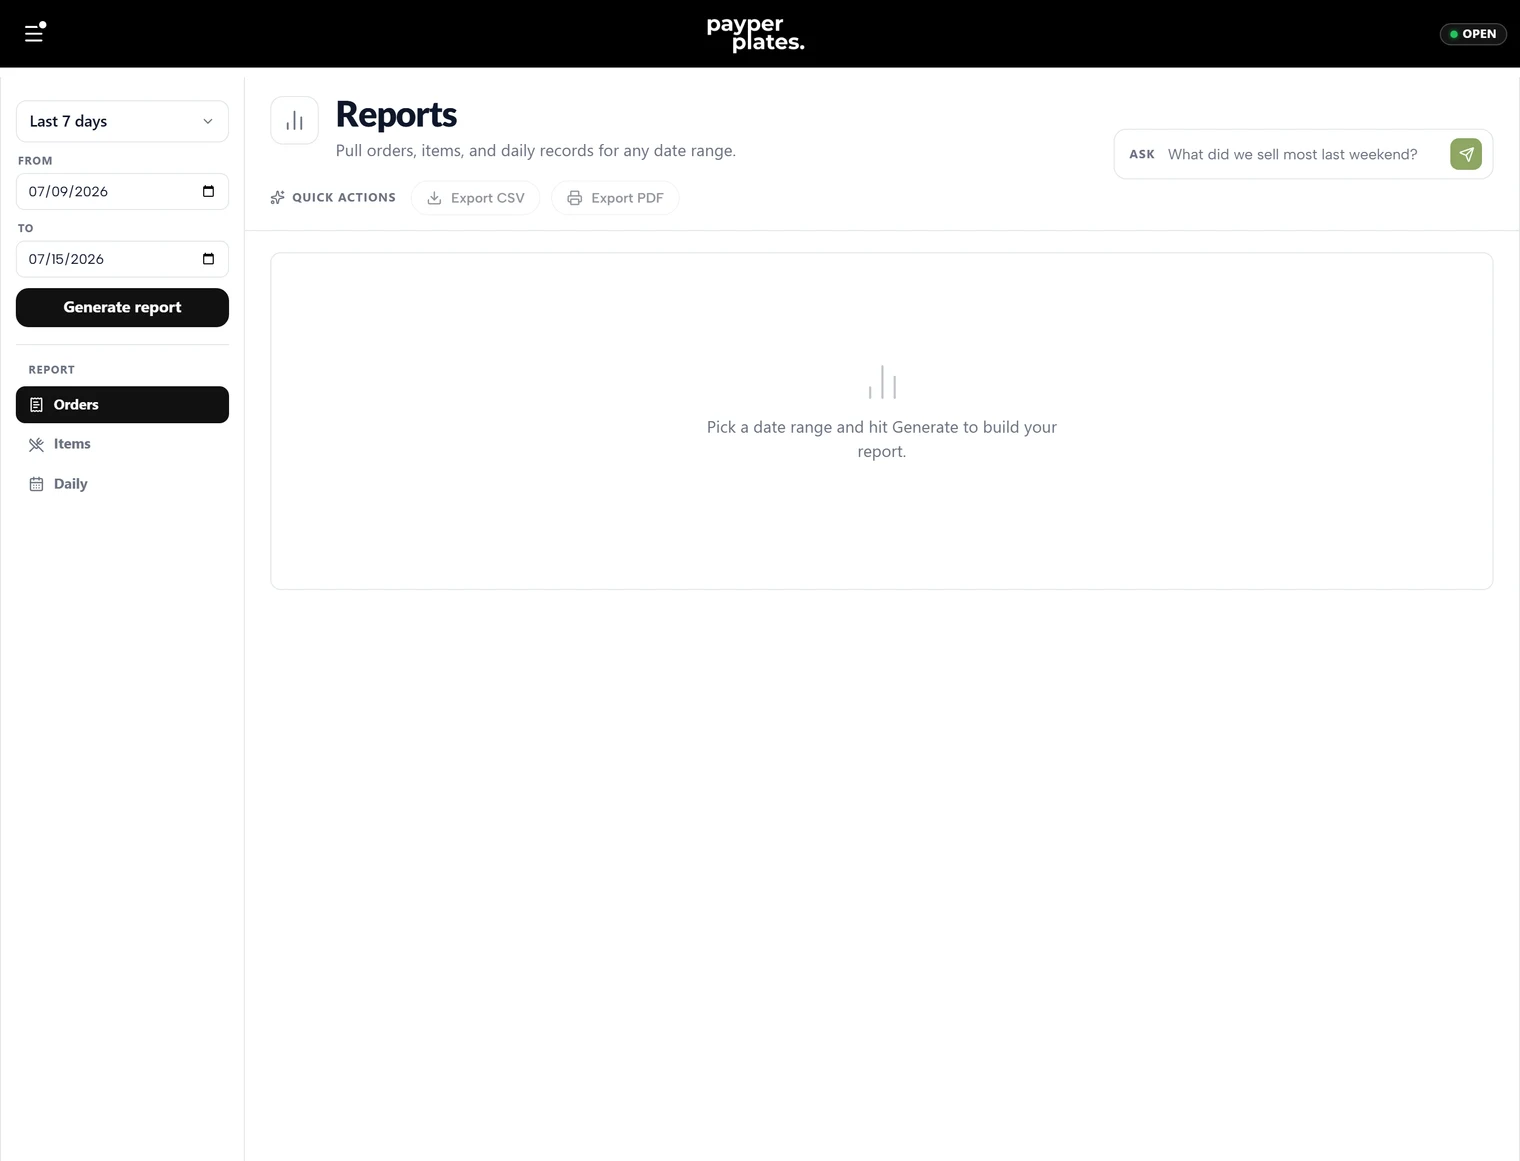
Choosing a period
Pick a preset (Today, Yesterday, Last 7 days, Last 30 days, This month, Last month or This year) or set your own dates, and the menu switches to Custom range. Everything on the page follows the period you choose, with the previous period alongside for comparison.
The five views
Sales
Your headline numbers for the period:
- Gross sales, less Discounts and Refunds, gives Net sales.
- Tax collected, Tips and Delivery fees, shown separately.
- Charged to customers, Refunded to customers and Net collected: the money that actually moved.
Net sales counts completed orders only. An order still in progress, or one that was cancelled, isn't a sale yet, so today's number grows as you complete orders.
Orders
Every order in the period, searchable and sortable. Filter by type (all, pickup or delivery) and by status (all, completed or cancelled). If your role allows refunds, you can refund an order straight from this table. See Refunds and cancellations.
Items
Which menu items sold and how much they brought in, so you can spot your best sellers and the items that never move.
Daily
Performance day by day, with net sales, completed orders and average order value, so you can see your busy days and your quiet ones.
Fees & payouts
What card payments cost you and where the money went:
- Card payments, Refunded to customers, Stripe processing fees, the PayperPlates fee (and any PayperPlates fee returned on refunds), and Dispute fees, down to Net to your Stripe balance.
- Every payout to your bank, with its status: Scheduled, On its way, Deposited, Failed or Cancelled. Stripe pays out every Monday.
- Your monthly plan fee and whether it's been paid.
See Card payments and payouts.
End-of-day totals
For one day's totals alongside your close-out, open that day under History on the Open & Close page.
Using what you learn
- Check Items regularly. Feature your best sellers in a hero banner and rethink the ones that never sell.
- Watch Daily to learn your rhythm, and plan staffing and prep around your busy days.
- Compare This month with Last month to see whether you're growing.
You can also ask the merchant assistant, "what were my sales last week?", or use the quick questions at the top of the Reports page.